Final update!
This is the final report, this the presentation summary. Follow the second collaborative observation!
Bug report – weakness in our dataset, and lesson learn before the next time!
- In { type: ‘home’ }, sections might contain ’null’ and this is a parsing bug.
- Few authorLink and authorName might miss. This is either a parsing bug and a logical bug. It might happens for video taken down by PornHub, or few video preview do not display their author, or not every video has a publisher because it can simply display do be of ‘Pornhub’.
- Despite we release a procedure of 7 steps, the tool implemented was considering only 6 of them.
Update n.6 – 2 February 2020
Final complete and clean dataset. Few errors were present in v2, this CSV v3 guarantee 100% presence of author and video name.
Update n.5 – 25 January 2020
TL;DR: first analysis: on tableau you can download the file in CSV v2 or JSON v2. Below some primary findings. We answered to few basic research questions, and the visualization below might help to get what the dataset has.
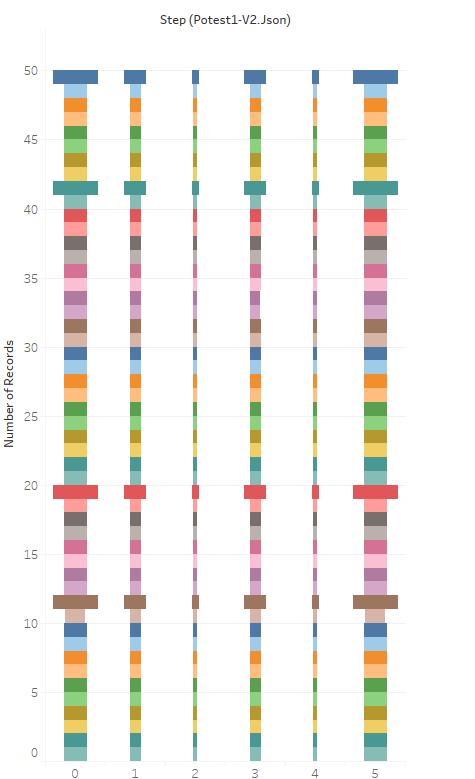
Each of the colored rows above represents a unique contributor. They were 50 in this first experiment. The vertical column represents the number of entries we have for each of the steps requested by the methodology.
Step 1 has 51 entries (equal to 51 videos) because access to the homepage has 51 video, the second column contains 25 videos (recommended page), the third is about the ‘old video,’ as each video has only eight related content, e this lead to 8 entries in our CSV/JSON file. The fourth recommended again, fifth the recent video, and the last one is the homepage still.
By filtering type and step, we can isolate particular content, for example, in the following graph, we look at the videos in the /recommended page, and compute a basic statistics out of it:
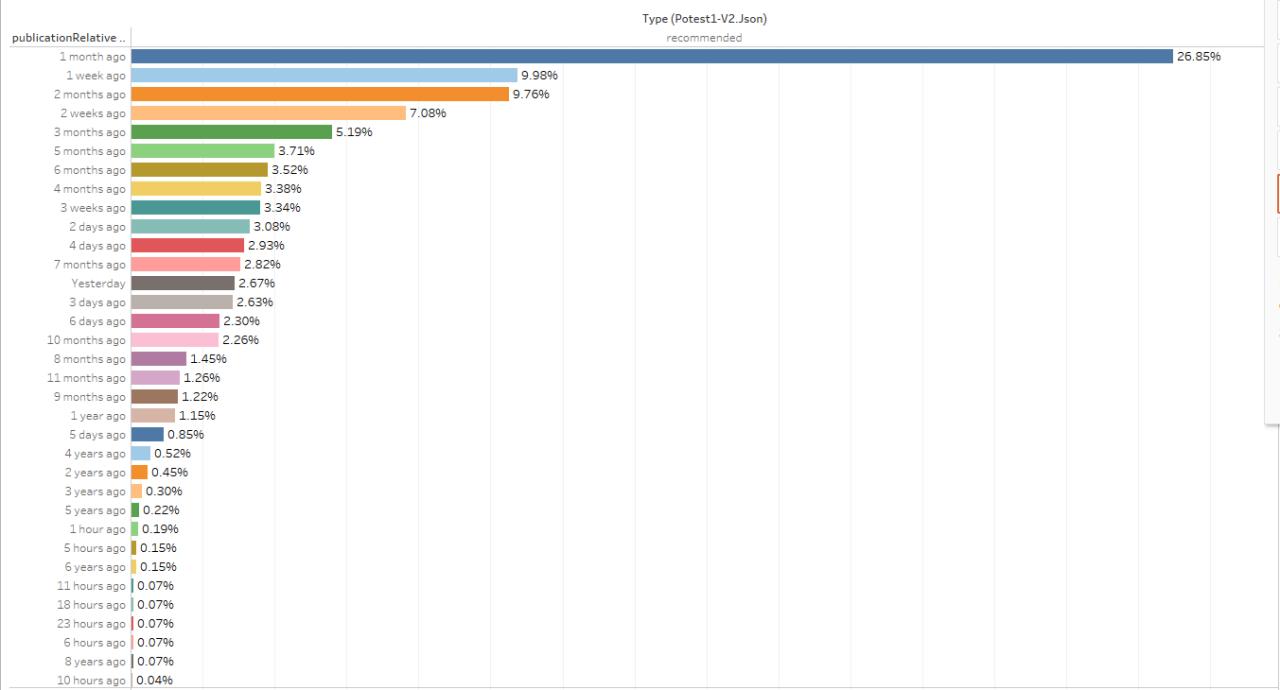
Meaningful or not, the graph might display the broader majority of recommended video os one-month-old. It would be best if you weren’t so sure. This graph is using as aggregation point the ‘humanization of time duration,’ and if you manually count the videos belonging to the last seven days, it is circa 21%. Still, this graph might become interesting if zoom in outliers such as the videos older than six months ago, and perhaps compare them with the view count.
Let’s compare the recommended video in step 2 (after the homepage) vs. the recommendation got at step 4 (after having watched the 11-years-old video)
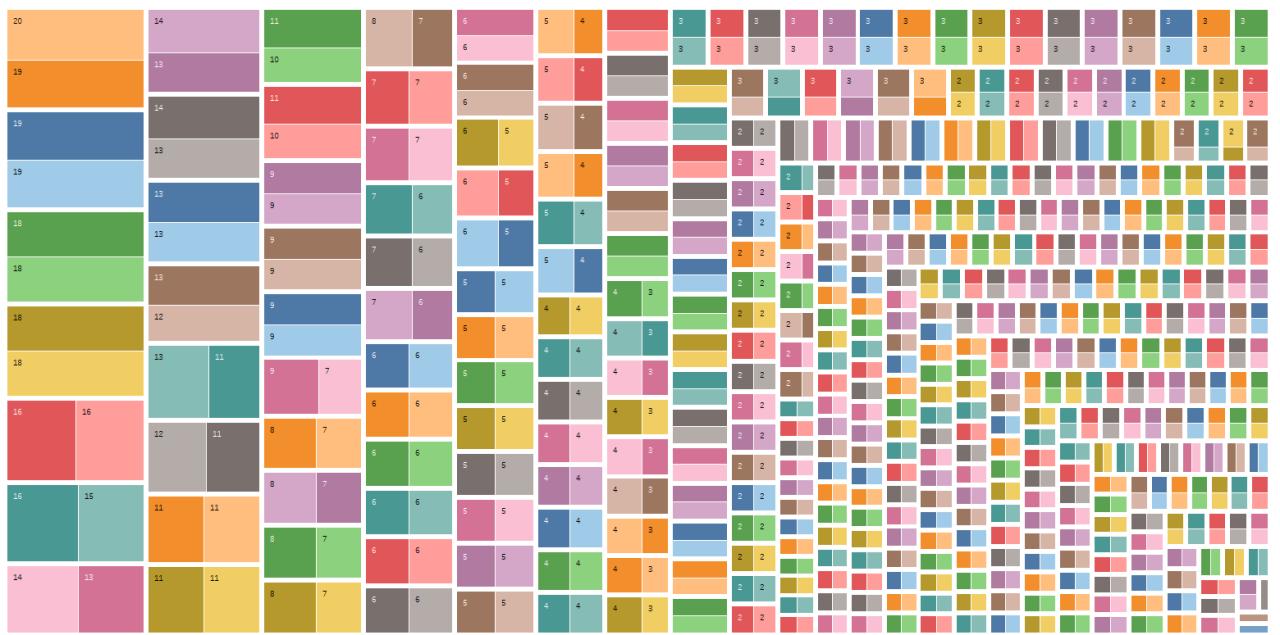
Take into account the top square: each square represent a video. The lighter/darker color represents the two steps (2 or 4), the number written in the box, is the amount of time the video was recommended.
Long story short: few videos were recommended more (and this is not a big deal), and there was a negligible variation between steps 2 and 4. we can safely assume, one old video is not enough to change the recommendation.
It might be due because recommended works only for logged profiles, or the nature of the old video, or because one video only was not enough.
By filtering with ‘type,’ we look only at eight related videos below the video we were watching:
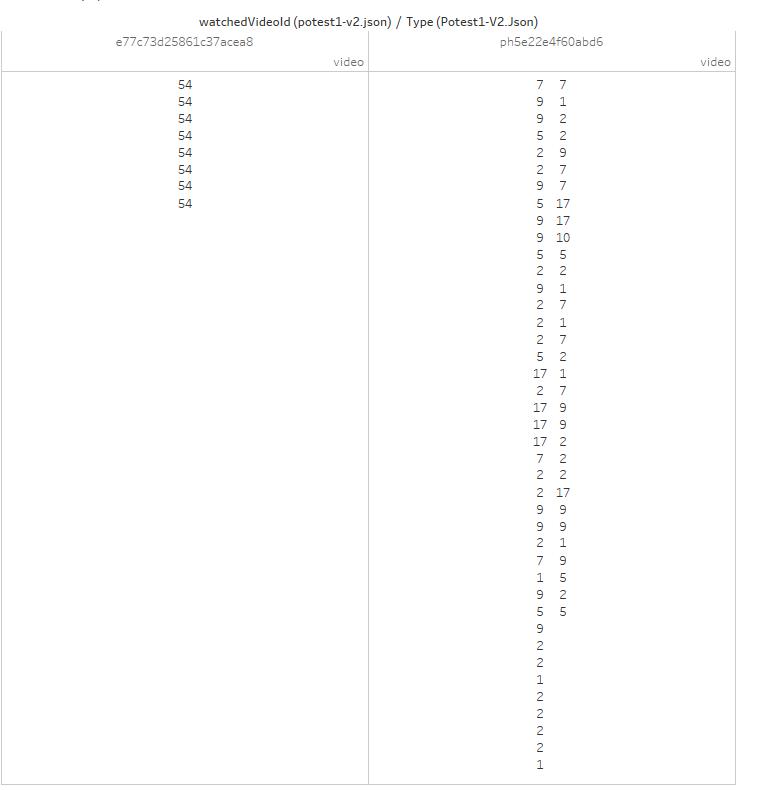
The video on the left is the 11-yo-video, and in 54 access, it got the same eight recommendations. On the right, you’ll see the video one day old, has a video related seven times, another nine times, and so on. Our simple interpretation regards the video age. Videos of the past, unlikely changes their related content, and entirely become tight to their selected eight, after a while. Otherwise, we can assume the traffic generated to mature content is so dim to don’t cause a fluctuation of the related videos, and the new video itself keeps changes their order in the recommendation algorithm.
The next visualization looks only at the related video of this last one, and split the changes of the videos looking at the hours:
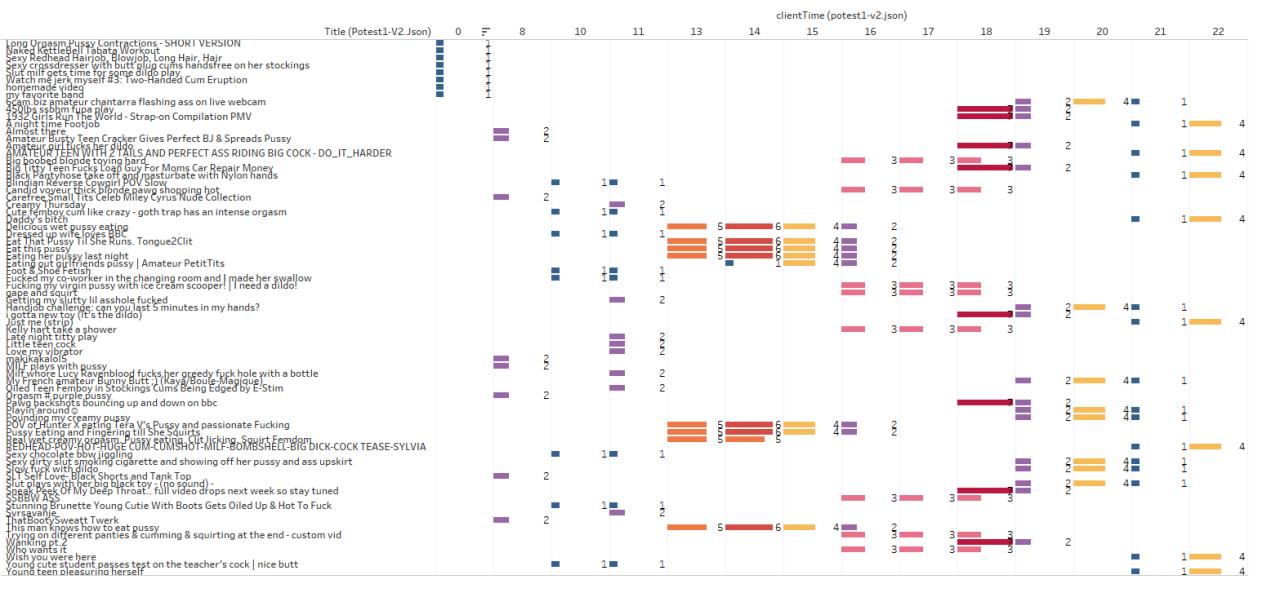
As it seems, videos selected to appear below a watched video, change often during the day, and in few slot of hours the recomendation are consecutives.
How we produced the files ― a scripts iterate in our DB by looking at:
- all the publicKeys who contributed to each of the 4 URL included in the test
- then pick all the contributions and group them by publicKey
- then look for ‘sessions’, for example:
new contributor input: processing 6 evidence [5 minutes]  +4ms
scripts:potest-1-generator    + 0 (partial 2) counter left at 2 session 1 session size: 6 +1ms
Above, zero valid session saved. in 6 evidences, che contributor did not comply with the requested sequence.
new contributor input: processing 25 evidence [9 minutes]  +10ms
scripts:potest-1-generator    + 2 (partial 1) counter left at 1 session 3 session size: 25 +10ms
Above, a contributor provided 25 evidences. we extract two sessions, and the “9 minutes” means the contributor had the first evidence begin 9 minutes before the last one.
For each profile providing a full session, we saved the metadata. This produced a nested content, available as version1. On top of the post you can find the v2, which is better. This is the script source code, and this the JSON v1.
new contributor input: processing 7 evidence [5 minutes]  +4ms
scripts:potest-1-generator    + 1 (partial 0) counter left at 0 session 2 session size: 7 +3ms
Above, the most commonly observed behavior: a contributor providing one session of observation, and only that.
Update n.4 – 22 January 2020
Unfortunately, part of the tracking.exposed team has been busy travelling and developing some code. So, this means, that we don’t have yet the CSV to share, but the following is an initial breakdown. As introduction to our system, based on MongoDB, the data collections we have is structured as follows:
- supporters (can’t be disclosed, contains authentication token)
- htmls (raw htmls received by browser extension)
- metadata (the actual parsed information):
- metadata of type ‘video’ have tags, categories and the 8 related content
- metadata type ‘home’ have the five sections and the video display
- metadata type ‘recommented’ has a sequence of videos recomended by pornhub guesses
Gross entries count (which might also be collected when the test was over, and we have to decide if consider them or not):
> db.getCollection('htmls').count({href: "https://www.pornhub.com/", savingTime: { $gte: new Date("2020-01-19") }})
1027
> db.getCollection('htmls').count({href: "https://www.pornhub.com/recommended/", savingTime: { $gte: new Date("2020-01-19") }})
1031
The html saved are heavily duplicated: an observation might send up to 5 time the same html, which will contribute to the same metadataId. This is why we’ve to look at the unique number of publicKey (which is the user identifier)
db.getCollection('htmls').distinct('publicKey', {href: "https://www.pornhub.com/recommended", savingTime: { $gte: new Date("2020-01-19") }})
89 elements. Maybe not all the participants followed the script correctly, and perhaps our parser did not work in all the possible scenarios, but as a generic indication, we gathered 89 individual observations in our first test.
Is it bad or good? It is, of course, good news. It is representative? Of course it isn’t. Thankfully, it doesn’t matter yet since our first goal is to test out team, the tool, and start to measure the divergence between similar PH experiences.
Update n.3 – 21 January 2020
The recommended parser is supported now! each video suggested will be extracted with the following dataformat:
   {
     "order": 2,
     "duration": "35:55",
     "publicationRelative": "2 months ago",
     "views": "4.3M",
     "viewString": "4.3M views",
     "title": null,
     "href": "/view_video.php?viewkey=ph5d6b197f4129b",
     "videoId": "ph5d6b197f4129b",
     "authorLink": "/model/nyna-ferragni",
     "authorName": "Nyna Ferragni"
     "thumnail": "https://ci.phncdn.com/videos/201912/16/269034501/thumbs_10/(m=eafTGgaaaa)(mh=oEChYH3QEwc4Iyfh)8.jpg"
   }
The above json object is the second video snippet from a recommended page, now we will produce and share the final CSV as part of this experiment.
…In regards of the Chrome extension, it seems definitely blocked at the moment:

whatever, just a reason to consider firefox better.
Update n.2 – 20 January 2020
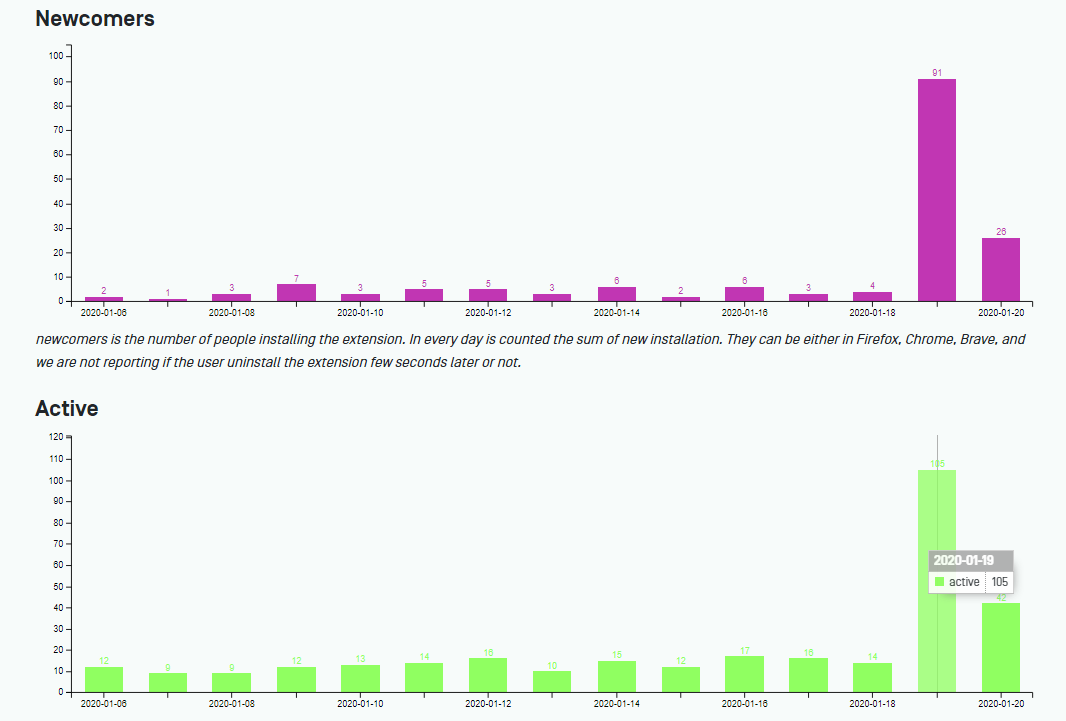
Despite Google didn’t enable our extention, a bunch of Firefox adopters supported our project:
Update n.1 – 19 January 2020
This test will work only with our firefox extension, because Google has put our extension under revision, and therefore it is not accessible to the public:

Announcement – 19 January 2020
On Sunday, January 19th, 2020: join the first collective observation of the #pornhub algorithm!
We are the tracking.exposed team and our main objective is to put a spotlight on users’ tracking, profiling, and the wider data market by performing an open algorithmic analysis. We believe that, as long as the operation of recommendation systems remains obscure, the many side-effects of platform economy cannot be tackled as they should.
After the development of the infrastructure and analysis tools facebook.tracking.exposed and youtube.tracking.exposed, we decided to take inspiration from the 34th rule of the internet: There is porn of it. No exceptions.
So, are now also focusing on online porn giant PornHub, trying to unpack the hidden logic of user profiling!
We do it because personalization algorithms have the potential to shape public perception, and Pornhub claims to implement some kind of personalization!
To do this, we need your help! Join our global test and explore for yourself how the Pornhub experience varies between users that are performing the same actions. You have to follow an 8 step script. (hard work for a Sunday!) After the test is completed and the evidence analyzed, we will release the dataset, along with some research and a final report, around January 30th, 2020.
You can find our browser extension on the pornhub.tracking.exposed website: it is necessary to participate, and collects what Pornhub send to you. Partecipation is anonymous, the extension can be used in Incognito/Private mode if you allow it, and for extra safety, you can even do the test with a browser you normally do not use (the extension runs in both Firefox and Chrome).
The test is simple — just follow the script you’ll find at this address: https://pornhub.tracking.exposed/potest/1. All you have to do is to click on a few links, and we’ll do the rest: by comparing multiple observations coming from our participants, we’ll measure how frequently personalized changes happen.
The test is not safe for work! We kindly ask you to watch the two videos that we selected after months of exhausting research, but if you don’t like them, don’t worry! Twenty seconds are enough for the extension to collect data and send it back to us. Of course, you retain full control of the evidence you send to us: by clicking on the extension icon, you can open your personal page, where you can eventually delete everything you sent us or play with our basic data analysis functionality.
Thank you, The pornhub.tracking.exposed team